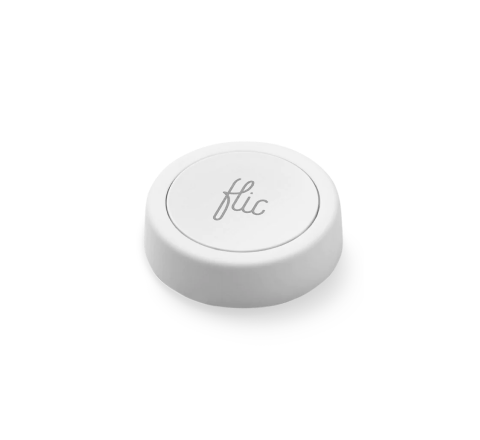
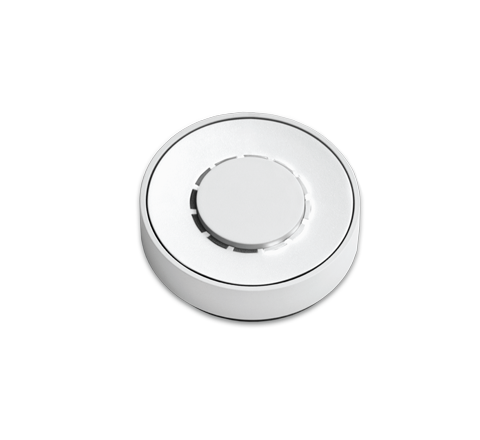
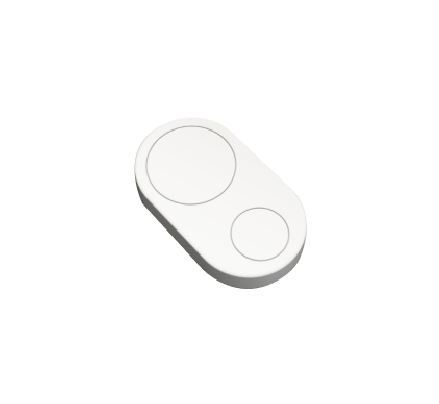
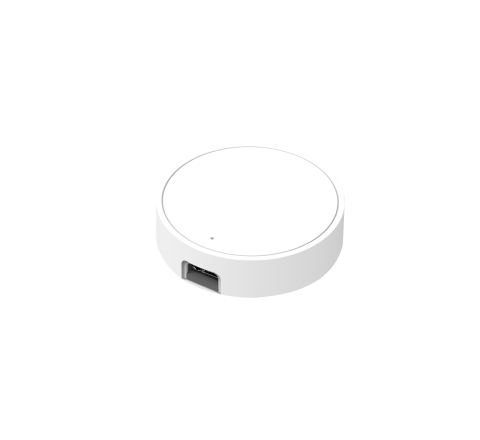
Google Analytics is normally used to track visitors on websites, but with a little creativity and a Flic button, it can be used to track events in the real world.
When Google Analytics launched universal analytics, they also launched a new API, called Measurement Protocol, to send data to Google Analytics from all kinds of places – not just from websites.
Today I will show you how you can use your Flic buttons and Google Analytics to track events that happen in the physical world. Like when someone takes a Pepsi cola from the fridge.

To be able to track Pepsi consumption in Google Analytics you need 4 things:
- A Flic button to push, when you grab a Pepsi
- The event data to be sent to Google Analytics
- A URL you can request, which will send the data to Google Analytics
- A nice way to visualize the data
1) Flic buttons are perfect for sending data to Google Analytics
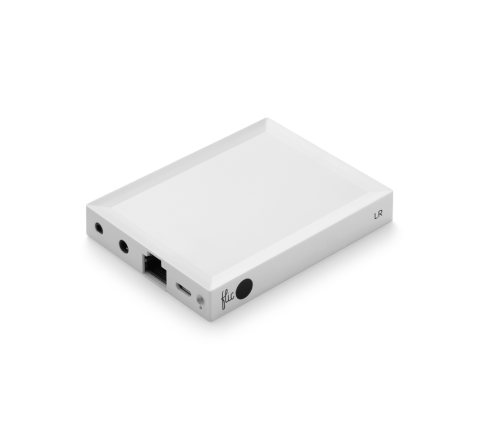
I recently received my first Flic Hub as the latest addition to my Smart Home. I use the clever little buttons all around my house to control my other smart devices, such as my Philips Hue lights.
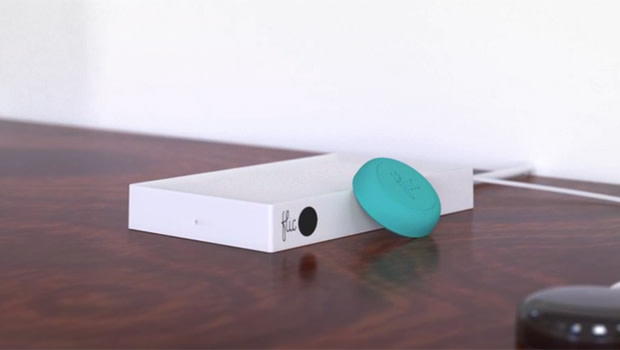
I have a Flic button taped under our couch table, which we use to change between different Philips Hue light modes, like a dimmed light for movie time.
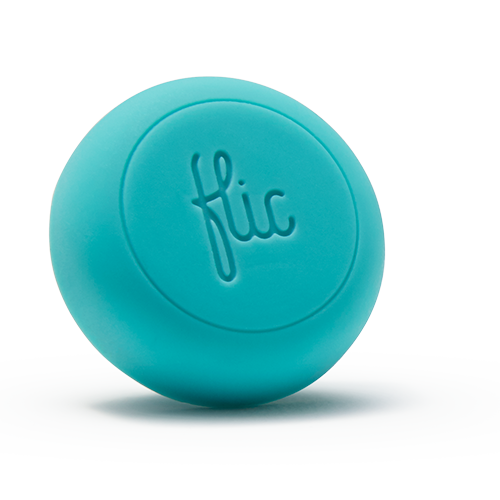
The buttons can do three things: one click, two clicks, and a long click.
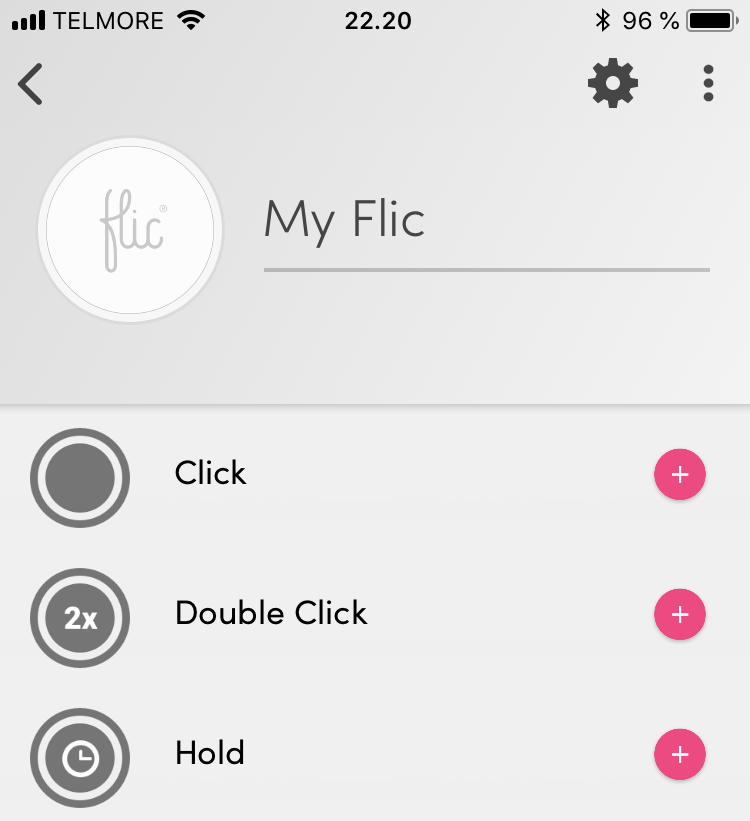
Every type of click can easily be configured to do a specific thing in the Flic app. Anything from Spotify, Philips Hue, IFTTT, Slack, Zapier, Chromecast, etc. can be controlled.
Basically communicating with a lot of predefined services.
Flic can request any URL = unlimited options
Besides the long list of predefined services, the Flic button can also be configured to request a given URL, defined in the app. This means you can call any given API or create your own API endpoints, that can do whatever you configure – the sky is the limit.
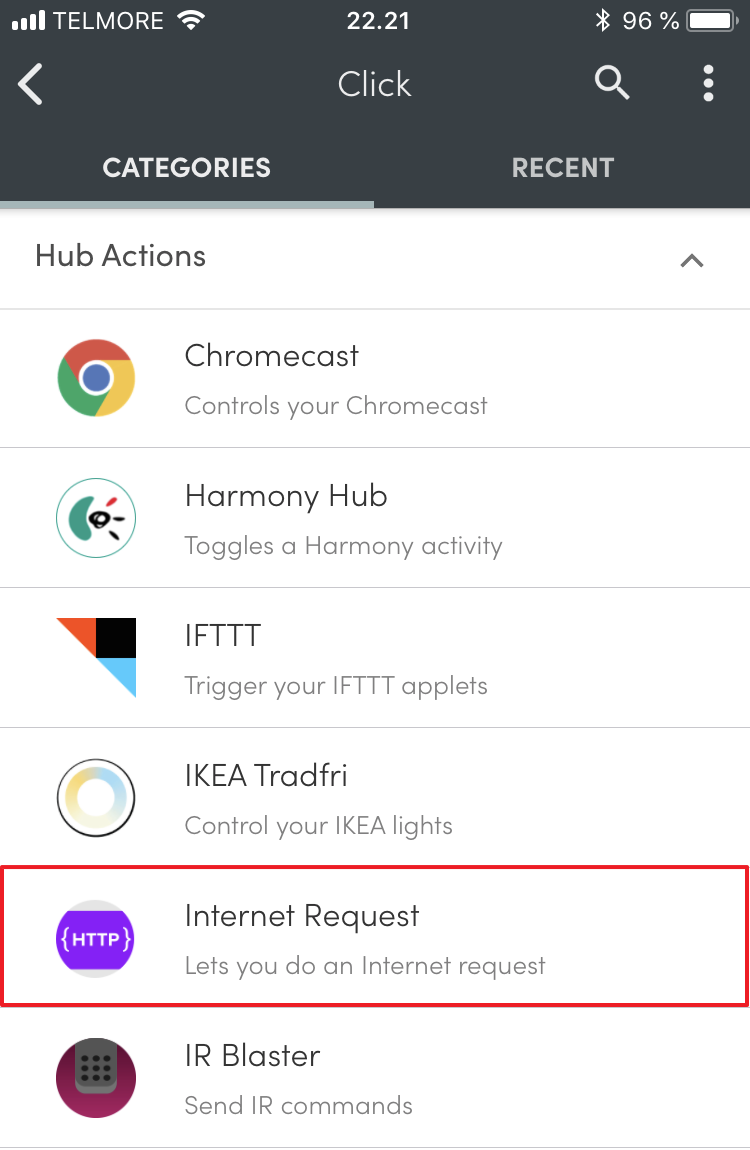
An example of such a URL is the Google Analytics API (Measurement Protocol) which can be used to send a tracking request to Google Analytics when you click the button.
2) Build the Measurement Protocol URL which sends the data
Google Analytics has a very neat Hit Builder to build the URL for you to call.
The documentation also includes a list of frequently used examples that can be used as a template to build from. In this example, I will use an event to track when someone grabs a Pepsi. Google Analytics events can consist of multiple data fields, that is structured in a hierarchy in the Google Analytics interface.
- Event category
- Event action
- Event label
- Event value

The complete Google Analytics event request consists of the following values:
- TID is your Google Analytics property ID
- CID is the website users cookie ID, which is not relevant in this case. We will, therefore, click the round arrow icon to generate a random ID.
- ec is the Event Category and is set to “Fridge”.
- ea is the Event Action and is set to the Pepsi you grab from the fridge, in this case, a Pepsi.
- el is the Event Label and is set to the person who takes a Pepsi, in this case, me.
- ev is the Event Value and is set to 330 because there are 330 ml in a can of Pepsi in Denmark.
We use the different clicks (1 click, 2 clicks, long click) to track different people taking a Pepsi. You could also use the different clicks to track different beverages like beer, soda, water, etc.
3) Validate the final URL
Hit Builder can validate the final URL and make sure all values are correct before you start using it.

Now that the URL is validated, we need to add
https://www.google-analytics.com/collect?
In front of the URL to get the complete URL we can insert into the Flic app.
This becomes the final URL:
https://www.google-analytics.com/collect?v=1&t=event&tid=UA-12345-1&cid=2dfc43a9-f225-4e20-81a8-af29ae8c834b&ec=Fridge&ea=Pepsi&el=Jacob&ev=330
Insert the URL in the Flic app
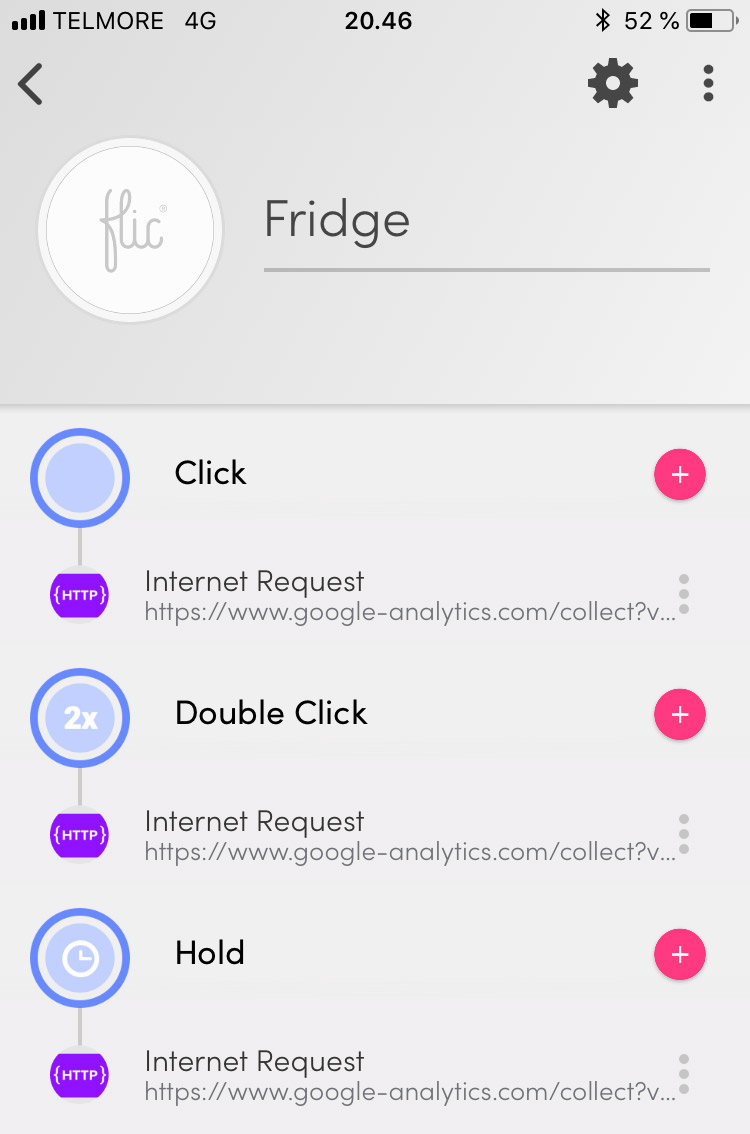
I have configured three things the button can do:
- 1 click: My wife takes a Pepsi
- 2 clicks: I take a Pepsi
- Long click: We take a Pepsi to share
In the app, I enter these three urls.
Testing the button in Real-time Analytics
Time to test the button!
1 click, 2 clicks, long click.
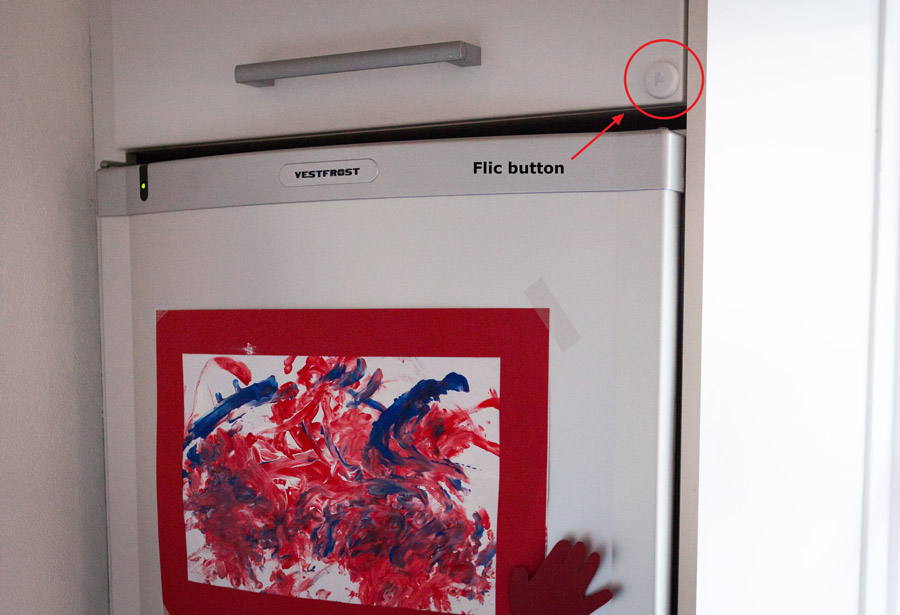
And then you just need to mount the button in an obvious place so you remember to click when you take a Pepsi from the fridge.
View the new data in Google Analytics
After the button has been mounted it is time to view the new data in Google Analytics.

Very cool, but let’s add some charts.
4) Dashboard in Google Data Studio
By taking advantage of the built-in dimensions in Google Analytics you can break down the events by hour and day, to see a what time during the day and week, you are most likely to grab a cold Pepsi.
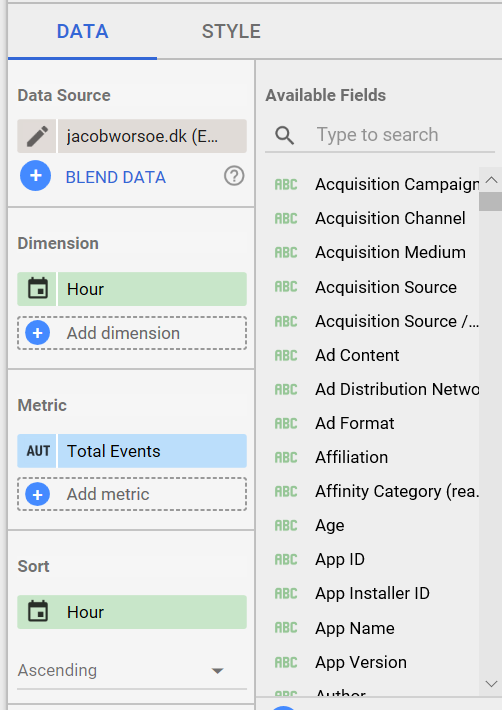
You can change the name of the Y-axis from “Total events” to something like “Pepsi during the day” by clicking on “AUT” in the blue box.
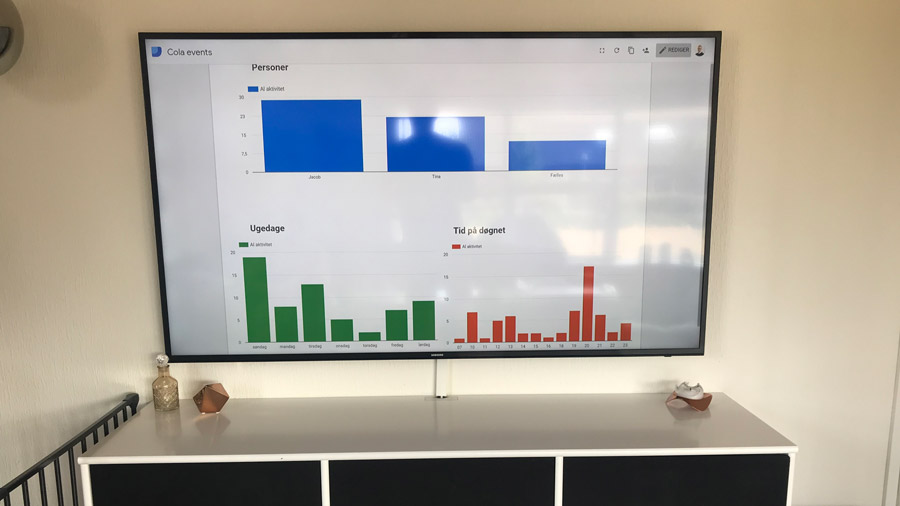
We drink most Pepsi in the first days of the week
At least that’s the trend at my house. What is the trend for you?
8 pm is Prime Time for Pepsi in our family
It is clear to see that we often enjoy a cold Pepsi when our 2-year-old daughter is asleep at around 8 pm and it is time to relax on the couch.
And what better thing to watch on the TV than the new Data Studio dashboard broadcasted to a Chromecast.
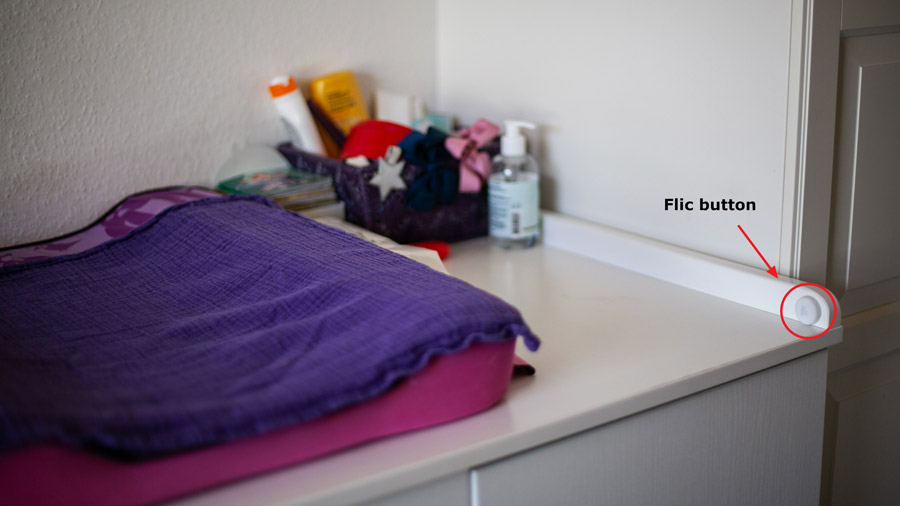
Flic button at the changing table?
I love adding data to decisions (or important bets). Therefore we also have a Flic button at the changing table.
 About the author: Jacob Worsøe is a Google Analytics expert from Denmark who enjoys collecting data to better understand the world around him – both online and offline. Flic buttons is a perfect way to collect data about the offline world. Follow him on Twitter at @jacobworsoe.
Article originally published (In Danish) on https://www.jacobworsoe.dk


